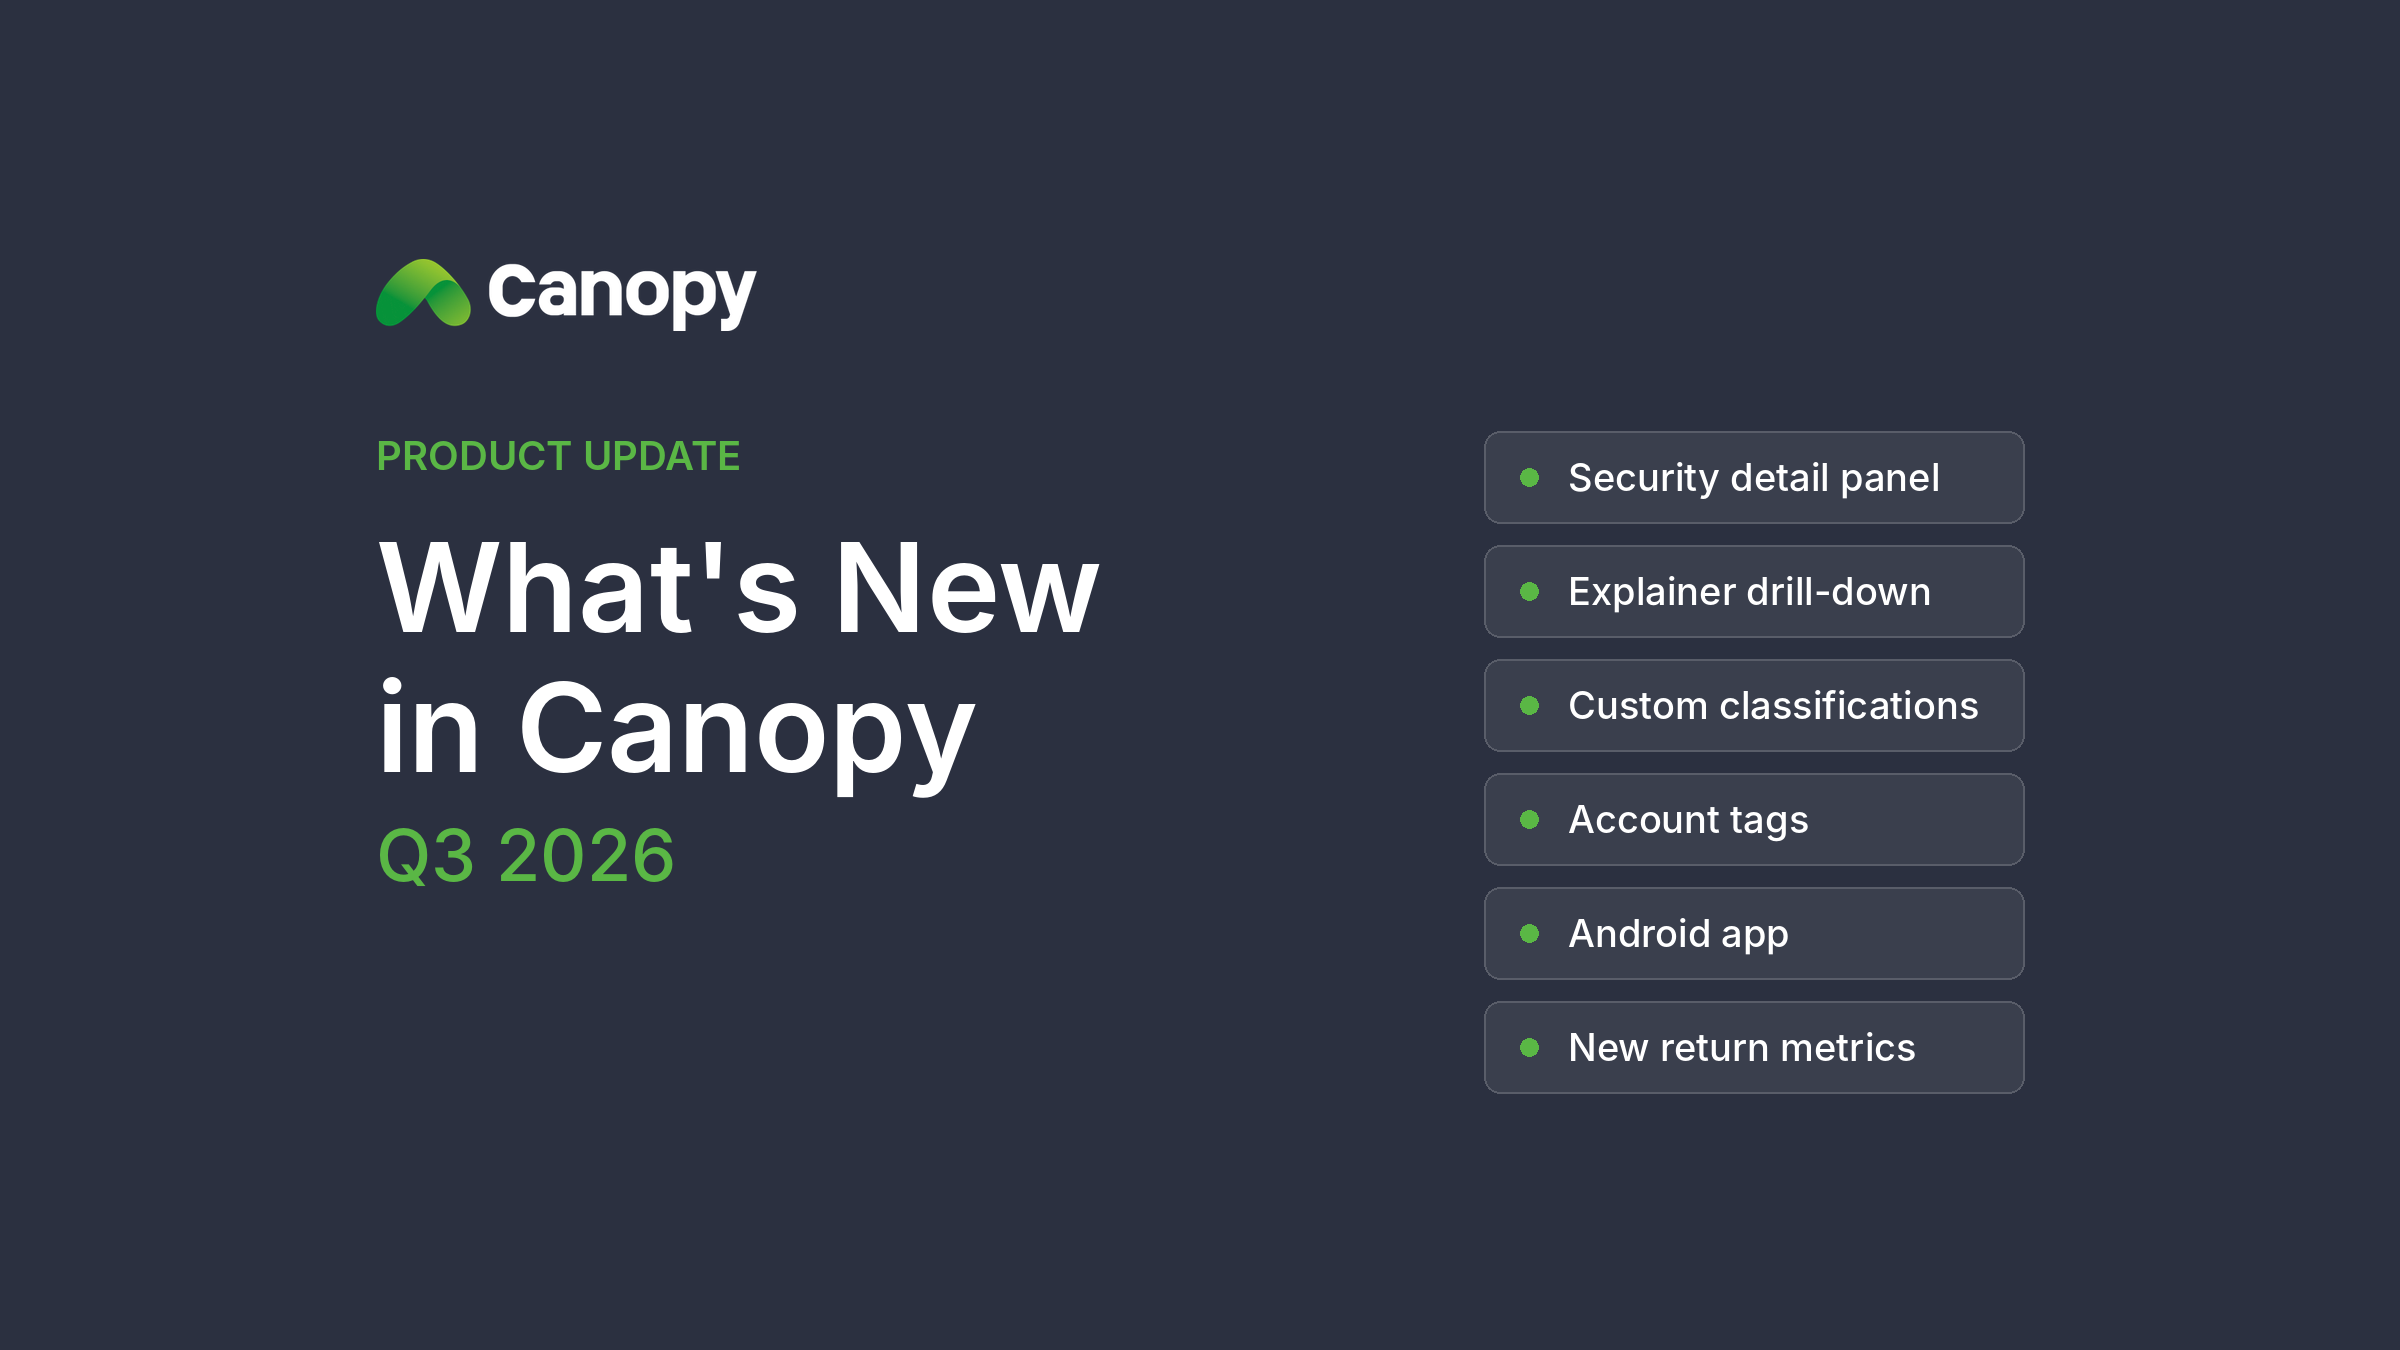
We're glad to share what's changed in Canopy over the first three quarters of this year. Some of it you may already be using, some you may not have noticed yet.
Click a security, see the whole picture
Click any security in the holdings table and a panel slides out on the right with:
- Position — quantity, cost, market value, gain/loss
- Breakdown by custodian and account — see at a glance where the same security is held across multiple places
- Price chart — your own trades are marked on the closing-price line, so you can see exactly where you bought and sold. The time range adjusts automatically to how long you've held it
- Latest 5 trades — with a link through to the full transaction history for that security
Each block collapses independently. Cash positions don't open a panel, securities that aren't marked to market don't show a price chart, and FCNs keep their existing Basic / Underlying tabs.
Click a number, see how it was calculated
On the Explainer page, every number can be opened up into a breakdown table showing which securities make up that figure and how much each one contributed.
You can stop at the summary level or drill all the way down to an individual security. The columns adapt to what you're looking at — one set for asset classes, another for individual securities. The breakdown table can be exported, and edited inline.
It's particularly useful when reconciling: if a number on a report looks off, open it up and see what it's built from. Form your own view first, then come to us with the specific securities if you still need to.
Classifications in your own words
Until now, the four classification dimensions were ours, not yours. You say Bond internally; the screen says Fixed Income, and you lived with it. Wanted to group securities by ESG rating or by your own investment strategy? There was nowhere to put it. Wanted to change the asset class hierarchy? That was a support ticket and a wait.
Admins can now do all of this themselves on the Classification Settings page:
- Rename any of the four built-in classifications. The new name flows through the entire system — security details, filters, charts, table headers, exported files, bulk update templates. Existing data and reports are unaffected.
- Create your own classifications, one level or two, as many as you need. A classification you create behaves exactly like a built-in one: filterable, groupable, and available for tagging securities.
- Restructure the asset class hierarchy by dragging a sub-class under a different parent. Every security underneath moves with it. Before anything changes, you're told how many securities will be affected and asked to confirm.
- Export the mapping to Excel any time, for checking or for circulating internally.
Security-level tags are managed on this page too.
Changes apply across your whole firm — every client under it updates, and takes effect immediately.
Tag your accounts
This is a separate thing, and it lives in Firm Settings.
You can create your own tags for accounts and currency accounts, and use them to group and organise — by mandate, by manager, by internal ownership, however you work. Once tagged, you can group by those tags in tables and charts, and filter on them.
Android app is live
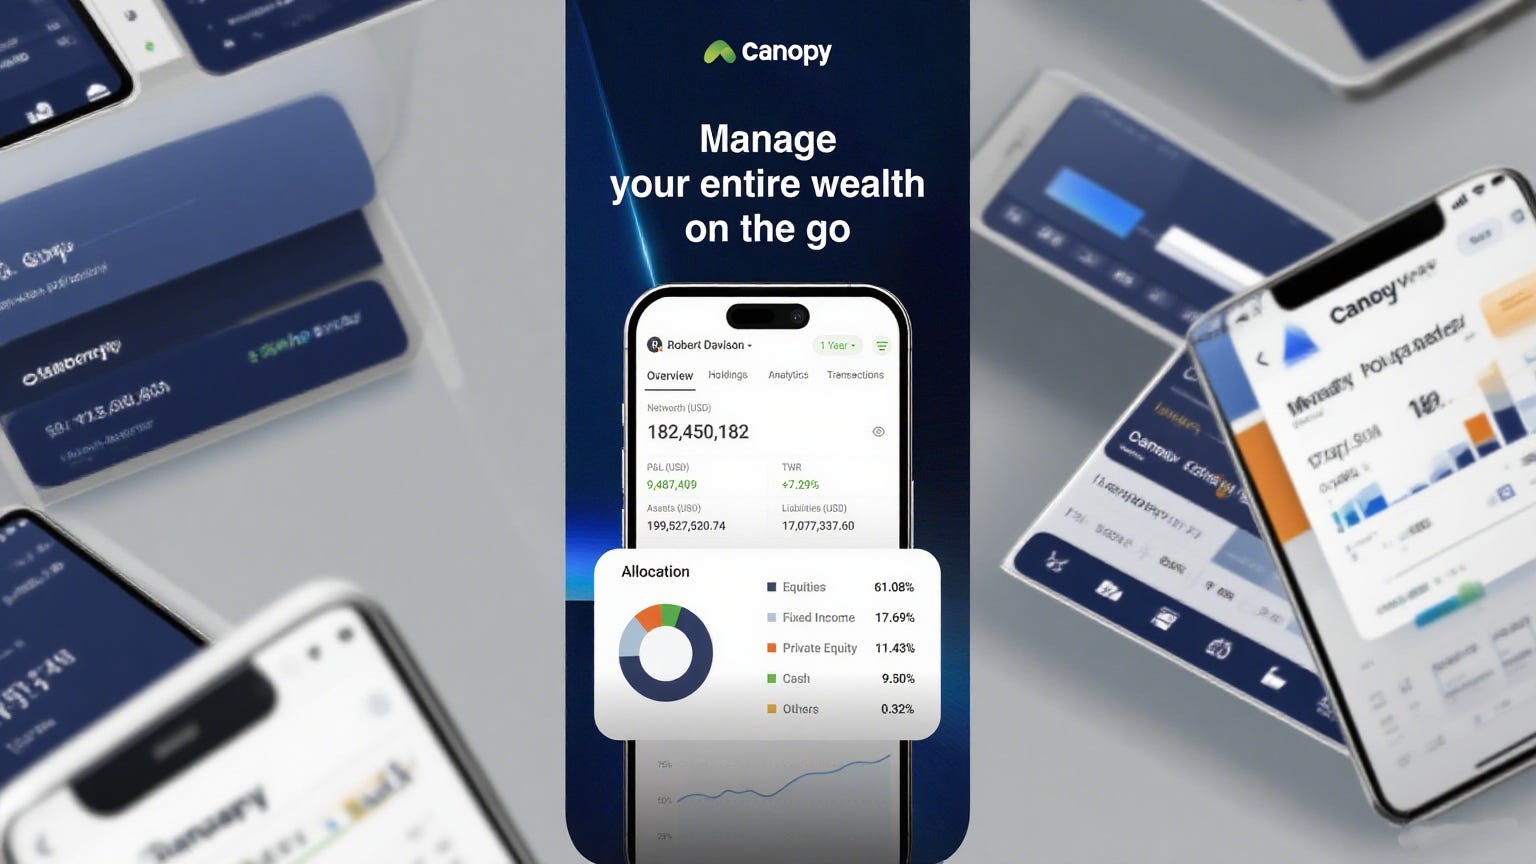
Canopy Portfolio for Android is now on Google Play, with the same functionality as the iOS app.
Previously only iPhone users could check portfolios on mobile — that's no longer a constraint. The login screen also lets you choose your region, including Europe.
Measuring returns
Several new metrics this year:
- Return on current cost — change in gain/loss divided by total cost, available at portfolio, account and individual security level.
- Annualised absolute return — absolute return annualised on a compounding basis.
- Risk contribution and correlation — building on the existing Value at Risk, you can now see how much each security or group contributes to overall risk, and how closely each one moves with the portfolio as a whole.
- Coupon rate at portfolio level — previously only visible per bond, now available at group and total level as a market-value-weighted average.
- Time-weighted return, cash flow adjusted — the standard calculation divides the day's gain or loss by yesterday's closing market value. But yesterday's value doesn't know money is arriving today, so a large purchase landing on a small position throws the daily figure badly off. The new metric adds the day's net inflow into the base before dividing. On days with no money moving in or out, the two are identical. Your existing time-weighted return is completely unchanged, and the new metric won't appear on its own — you add the column when you want it.
More flexible time periods
- Full range of frequencies — time series tables support daily, monthly, quarterly and yearly views, plus custom intervals. A transpose toggle flips time from running across to running down.
- More quick ranges — alongside MTD, QTD and YTD, you now have Previous Day, plus year-to-date starting from April, October or December.
Transaction and cash detail
- Cash balance after each trade — the transaction table works through chronologically and shows what's left in the account after every transaction.
- Settlement difference and gross amount — two new columns, available in both base and trade currency.
- FX rates — shown in both the holdings and transaction tables, to four decimal places.
- Base currency versions of settlement amount, remaining cash and other metrics, included in exports.
Everyday improvements
- Hide empty rows — a toggle in view settings hides rows and groups where every value is zero. It judges by the columns you're actually displaying, not hidden ones. Works in table view, dashboards and client view.
- Favourites — favourited views sit at the top of the sidebar, favourited attributes jump to the top of every picker, and both stay put when you switch clients.
- Manage your own views — rename and delete your personal views, with duplicate-name checking and a confirmation before deleting.
- Filters open with an operator already selected, so you can start typing straight away.
- More view tabs open at once — comparing views no longer means closing one to open another.
- Alerts — PAs see all alerts, RMs see only their own, and alerts switch off automatically for deactivated accounts. New alert metrics: days to maturity for bonds and FCNs, worst-of distance to knock-in, and allocation drift.
Faster, and steadier
We rebuilt the metrics calculation engine this year, covering gain/loss, IRR and time-weighted return, and it's now live for every client. Alongside it: a warm-up step so the first page load no longer has a noticeable wait, a large reduction in memory used during calculation, and faster loading for private equity time series charts.
Even portfolios with very large holdings now load smoothly.
Want to see it
For any of the above, the quickest way to understand it is on your own portfolio — just ask your relationship manager to walk you through it.
And if one of these happens to solve something you've been working around, do tell us. Most of this list started exactly that way.